

School · 2025
Interactive graphs
Step-by-step visualisation of the fundamental algorithms of graph theory.
The story
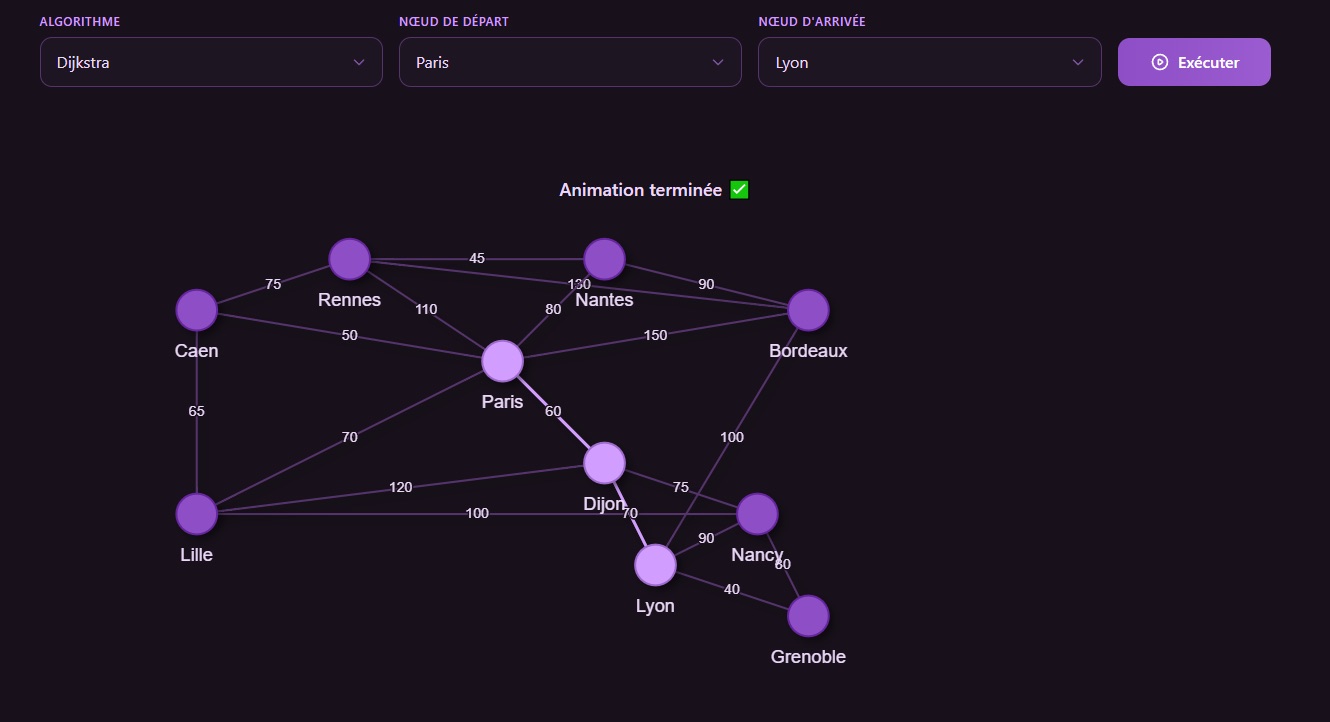
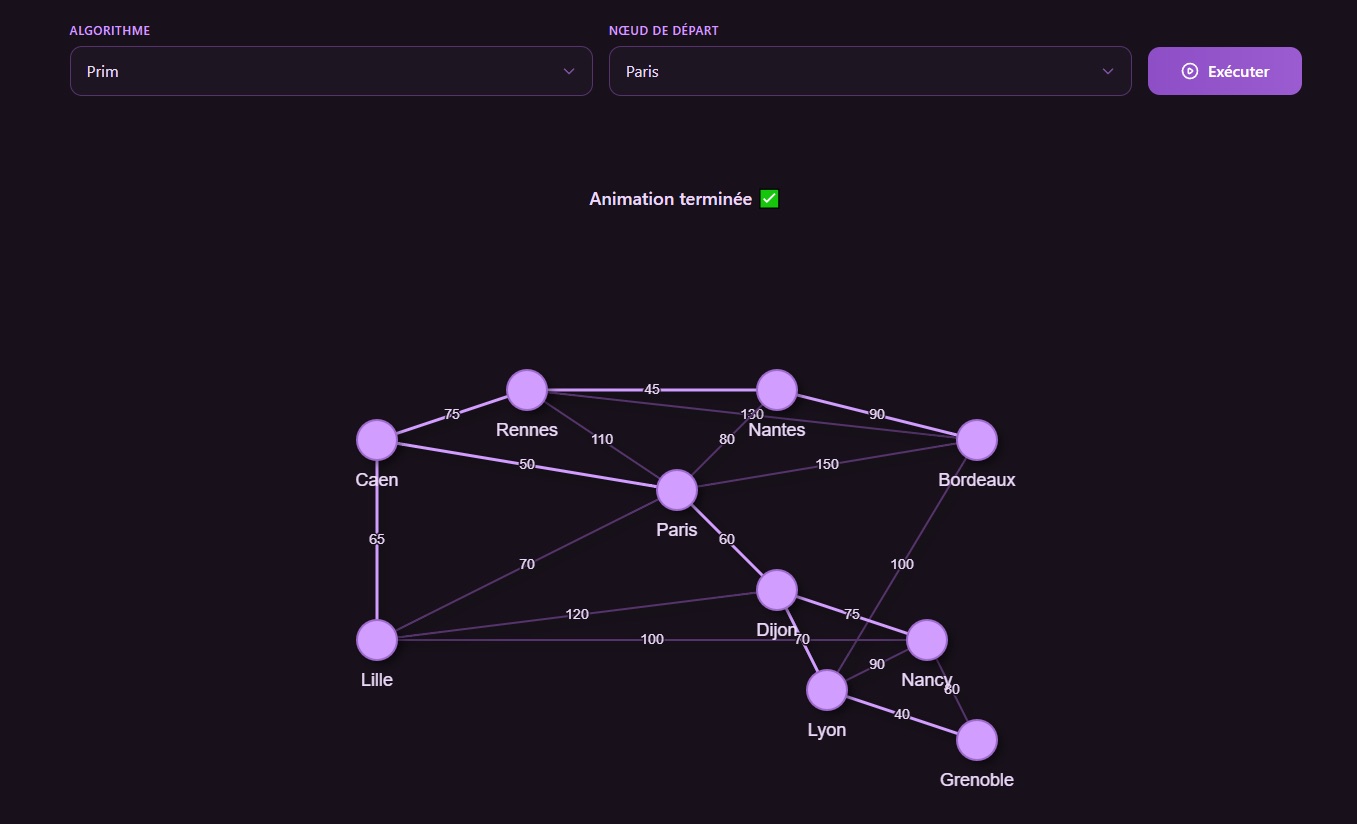
Graph Theory project (Efrei): BFS, DFS, Dijkstra, Bellman-Ford, Floyd-Warshall, Prim and Kruskal, run on weighted graphs with an interface that shows each step.
I had already lived it on the data side with a RATP metro route application (Python, Pandas, Flask) where Bellman-Ford and Dijkstra had to give accurate and fast results.
What I take away
An algorithm is better understood when you watch it run: the visualisation forced me to break each algorithm down into observable states.